QCCOMzenghi
Windows · Linux · v1.9.6

A serial monitor that
just works.

Finds the port, detects the baud rate and shows colored, timestamped logs. Serial, terminal, code, network and dozens of embedded tools in one window. One portable exe: no installer, no runtime, no admin rights.

Windows 10 / 11 x64 · 11.5 MB · Free & open source · Apache-2.0

Serial
Auto scan · auto baud
Encoding
UTF-8 · GBK · HEX
Terminal
VT100 · SSH · Telnet
Network
TCP · UDP · MQTT · BLE · Modbus
UI
Dark / light · 10 languages
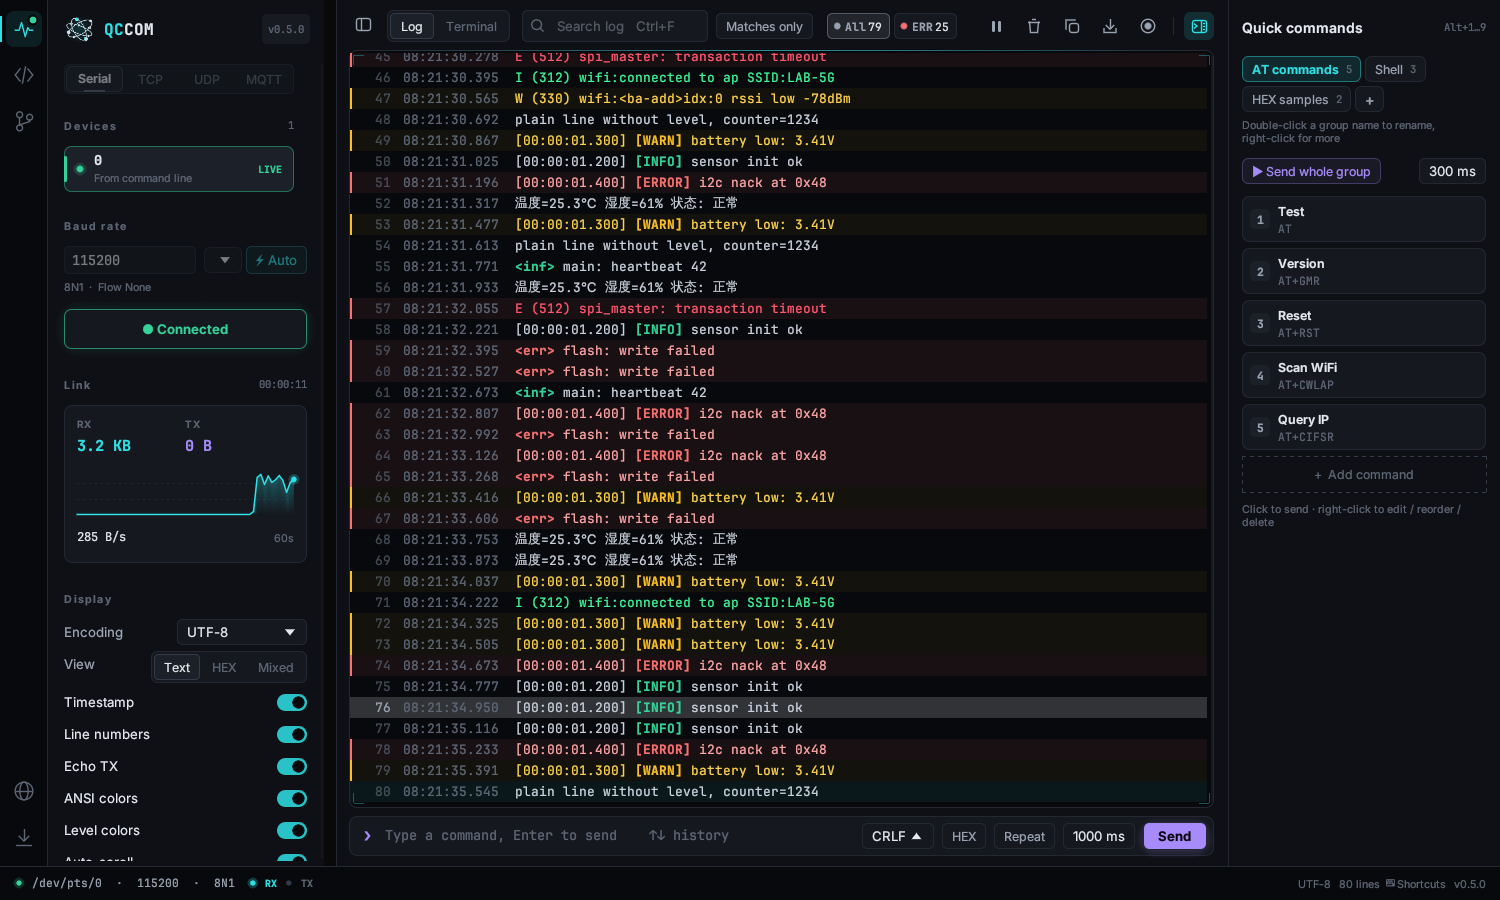
QCCOM serial monitor: port settings, colored log and quick commands
Demo

Things that work the moment you open it.

Recorded in the real app, not mock-ups.

01 — Serial

Plug it in and read the log. The baud rate finds itself.

Ports are rescanned every second and listed with chip name and VID:PID, e.g. COM5 · CH340. A new device is selected for you and reconnected after a replug. Not sure about the baud rate? Click “⚡ Auto”: QCCOM tries 18 common rates, scores the text for readability and connects with the best one. Switch between UTF-8 and GBK at any time; the existing log is re-decoded instantly.
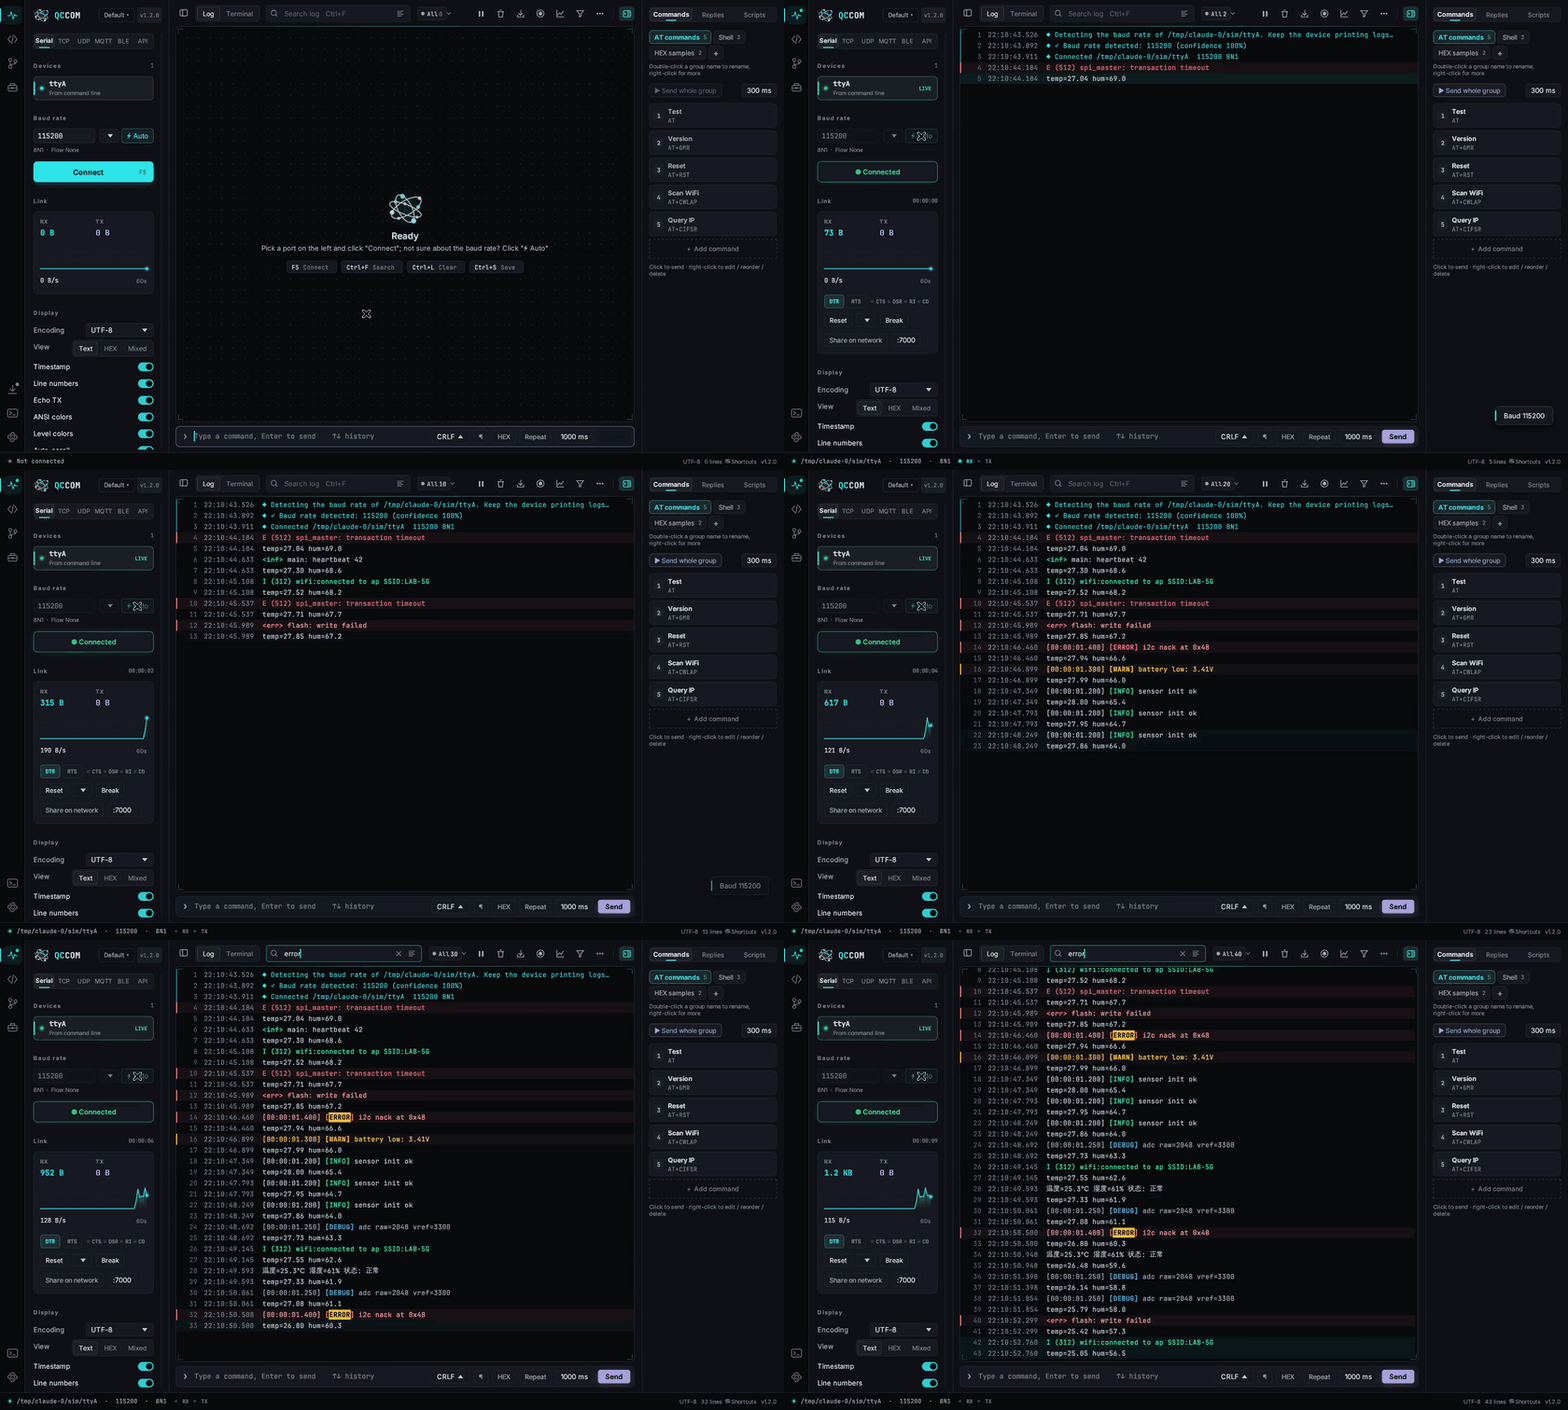
Plug it in and read the log. The baud rate finds itself.
02 — Terminal

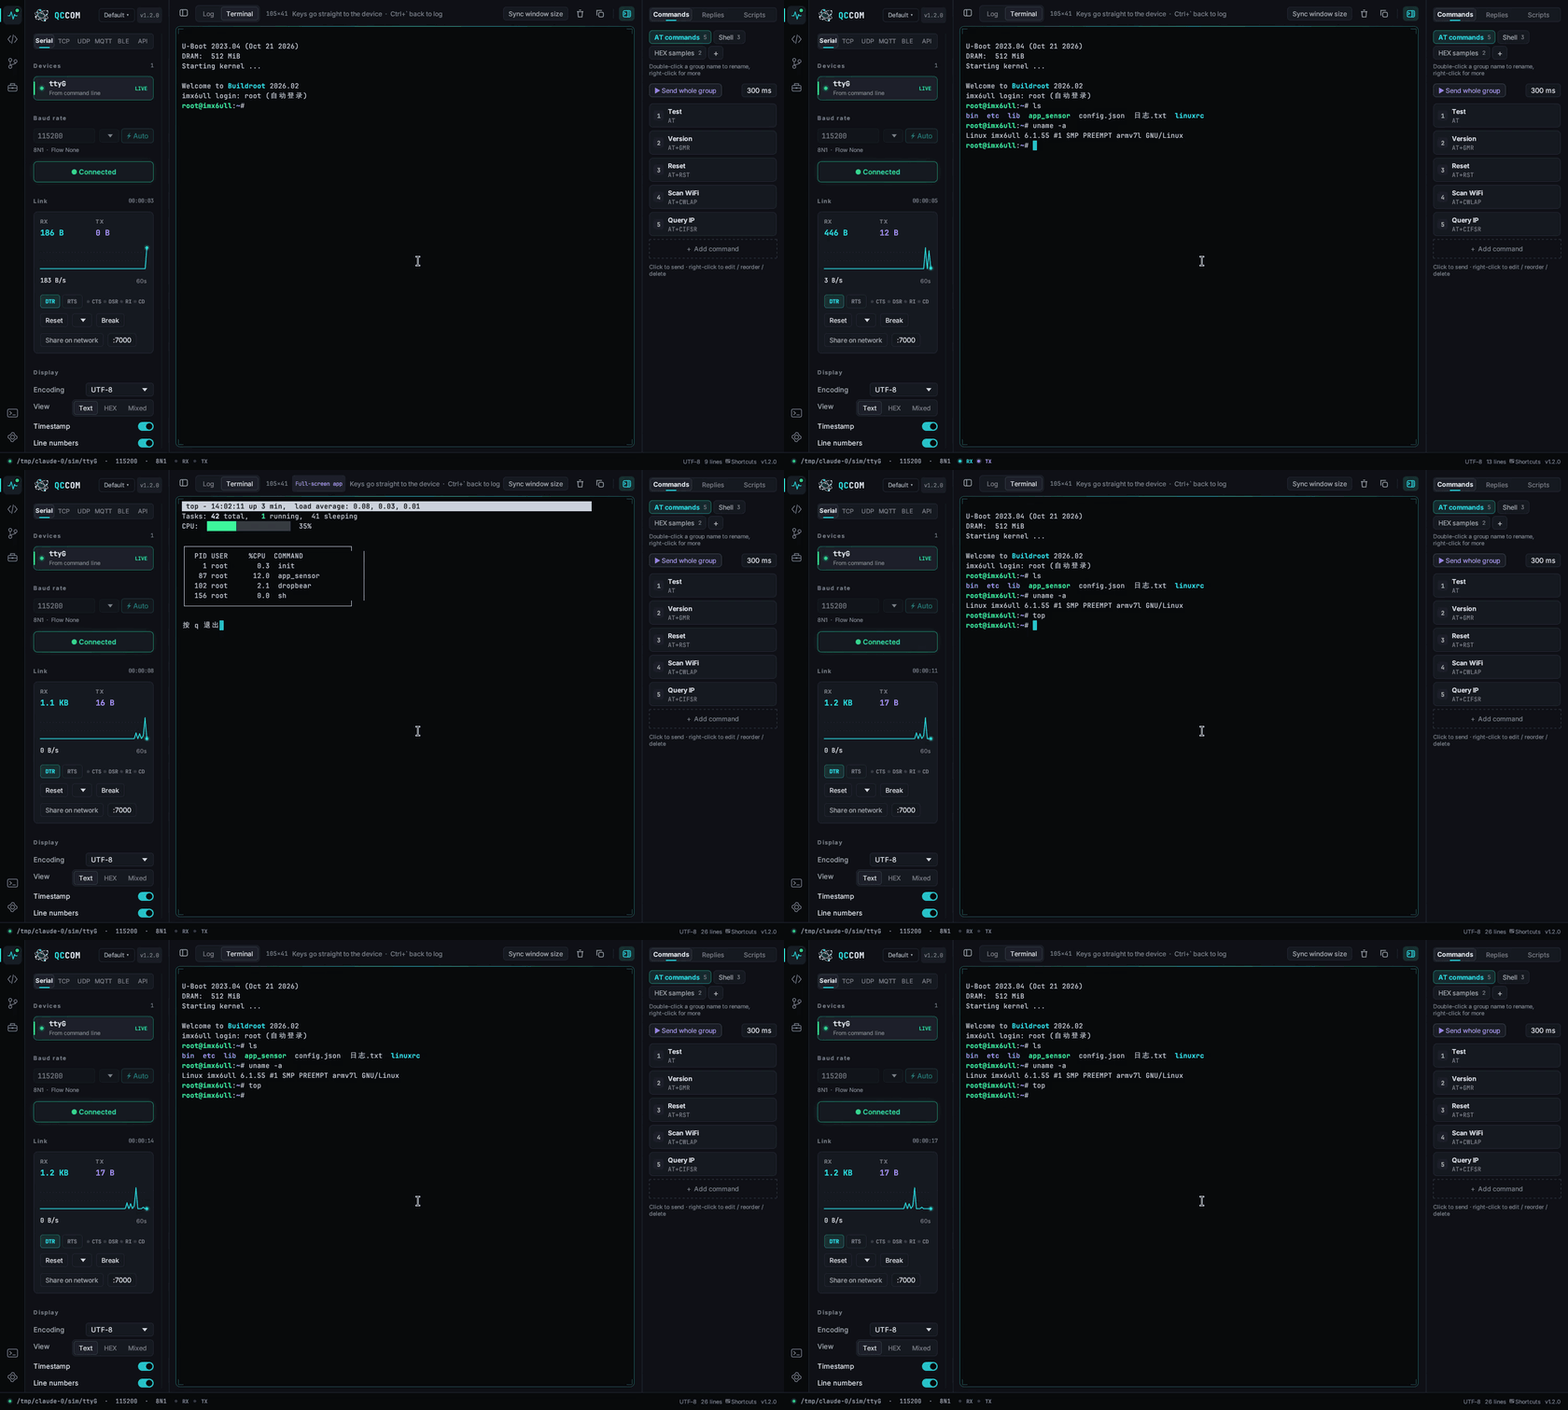
U-Boot and Linux shells, right in the window.

Press Ctrl+` for terminal mode: full VT100 / xterm emulation, so vi, top, less and menuconfig render correctly, with scrollback, mouse selection and copy / paste.

U-Boot and Linux shells, right in the window.
03 — Side by side

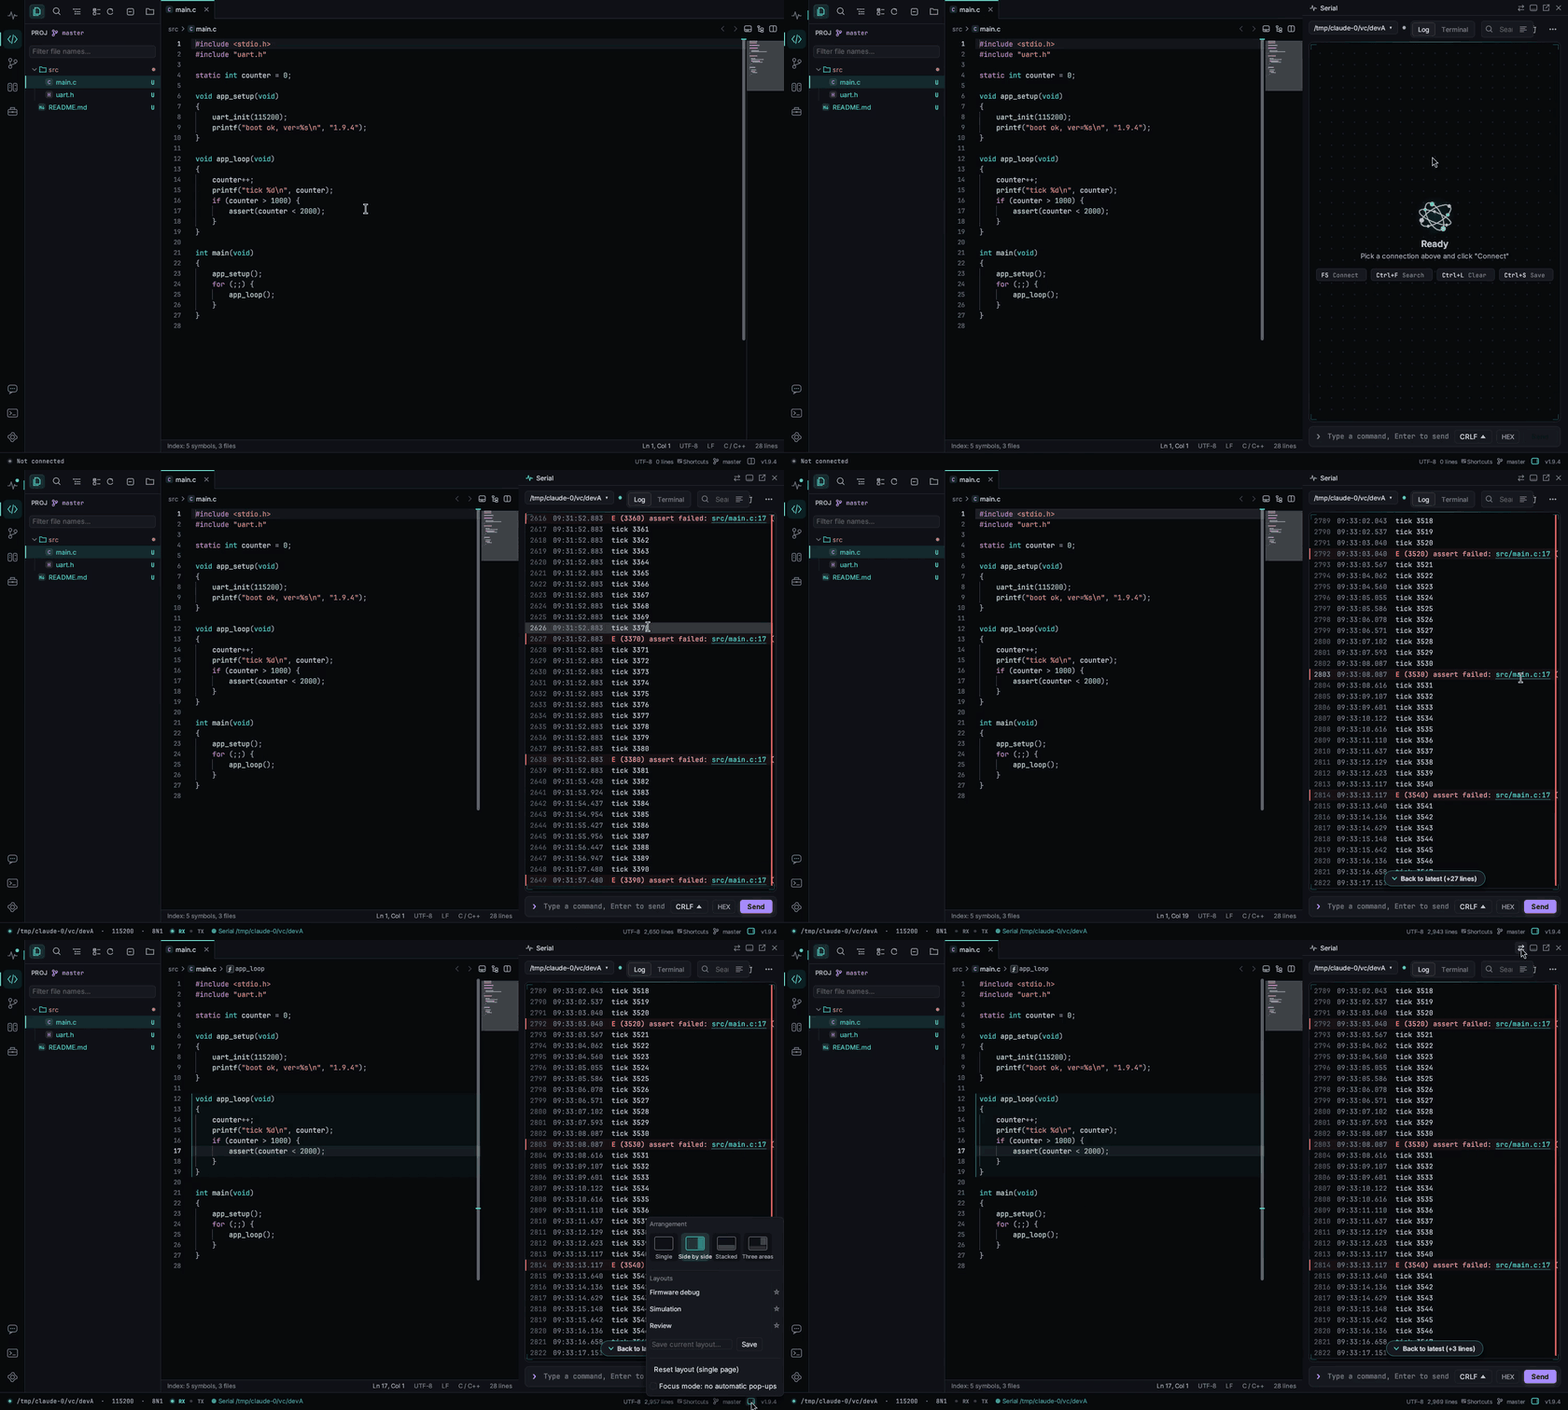
The log and the code, side by side.

A location like main.c:123 in the log opens next to it with Ctrl+click; HardFaults and asserts show a hint in the status bar. Any two pages (serial, code, compare, circuit) can sit side by side, and pairs you use often open by themselves.

The log and the code, side by side.
04 — Code

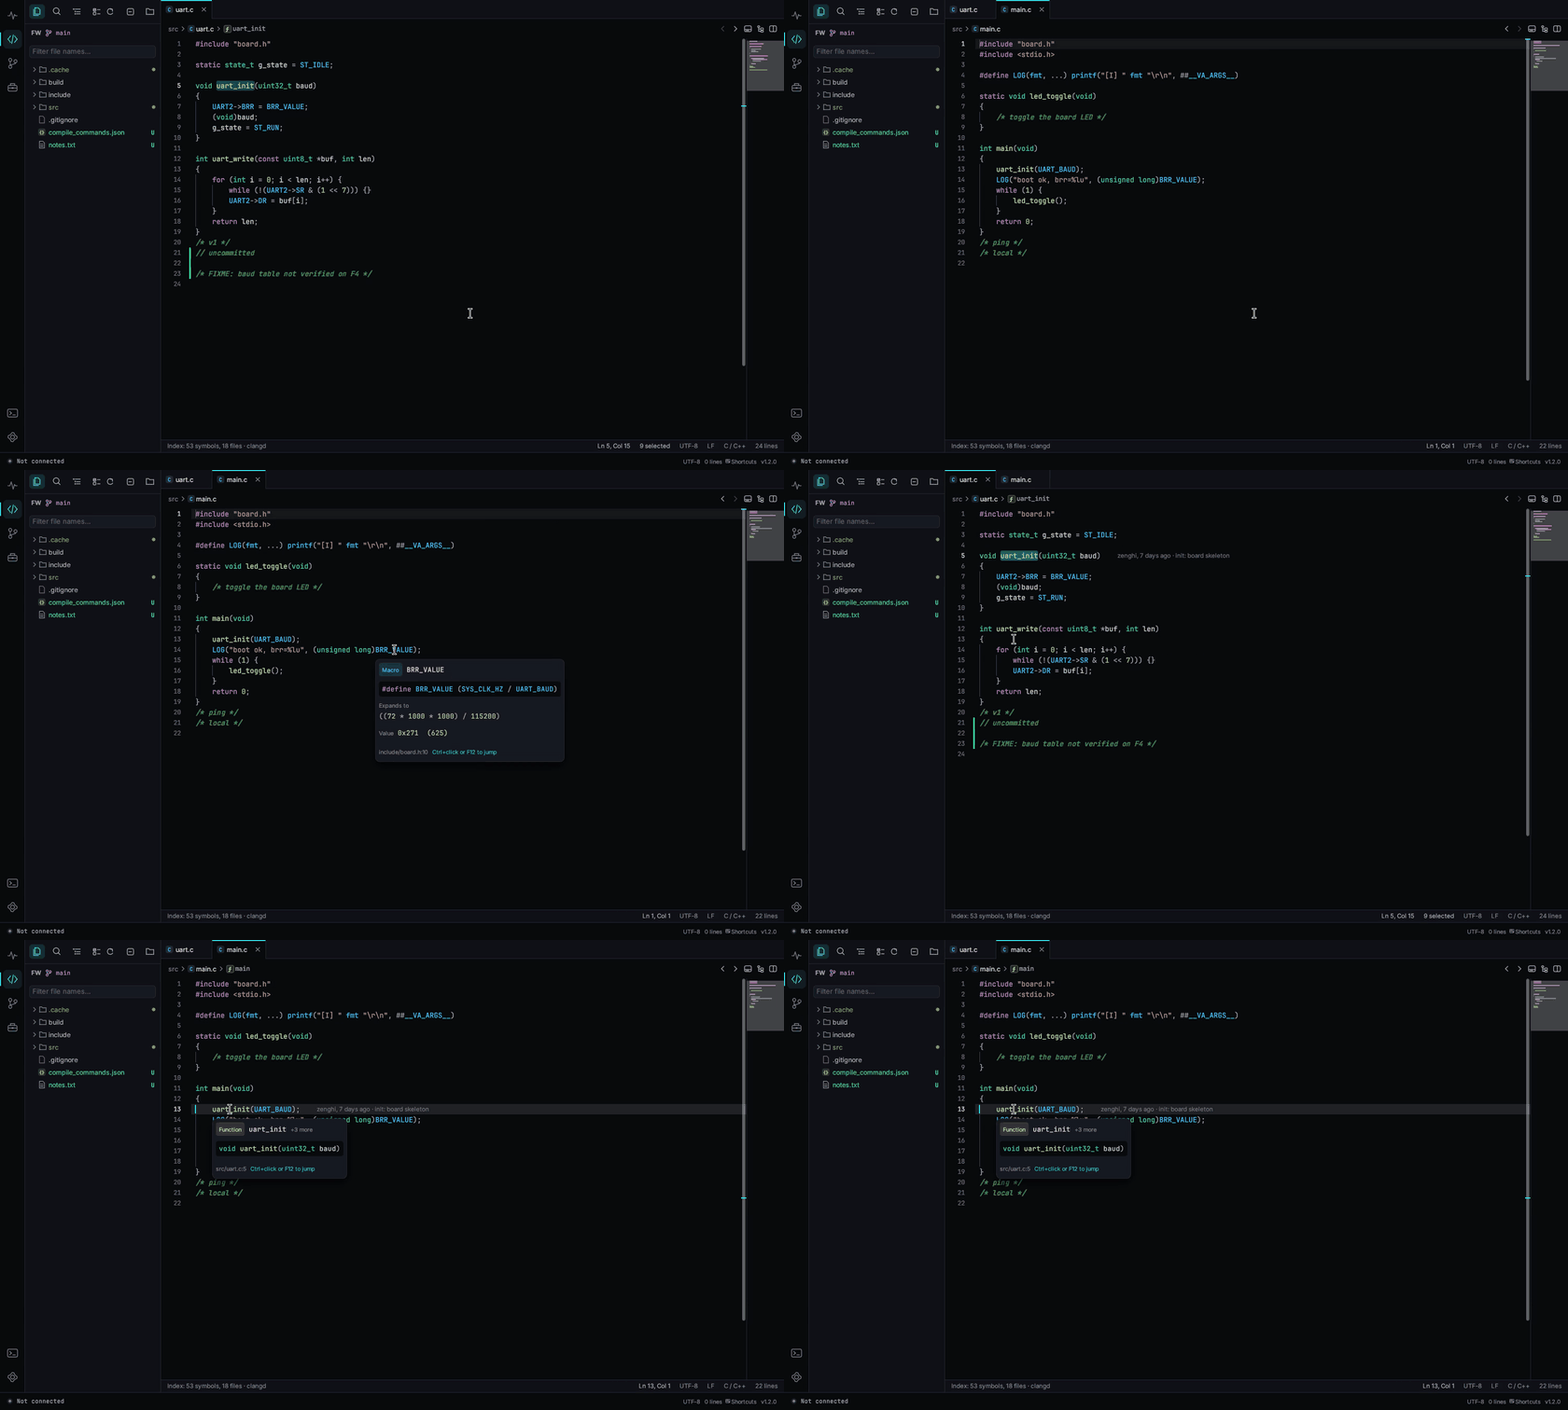
Go to definition and see what a macro expands to.

Open your firmware folder: C / C++ go to definition, find references and macro expansion with the computed value. clangd is used automatically when it is installed and the project has a compile_commands.json.

Go to definition and see what a macro expands to.
05 — Plot

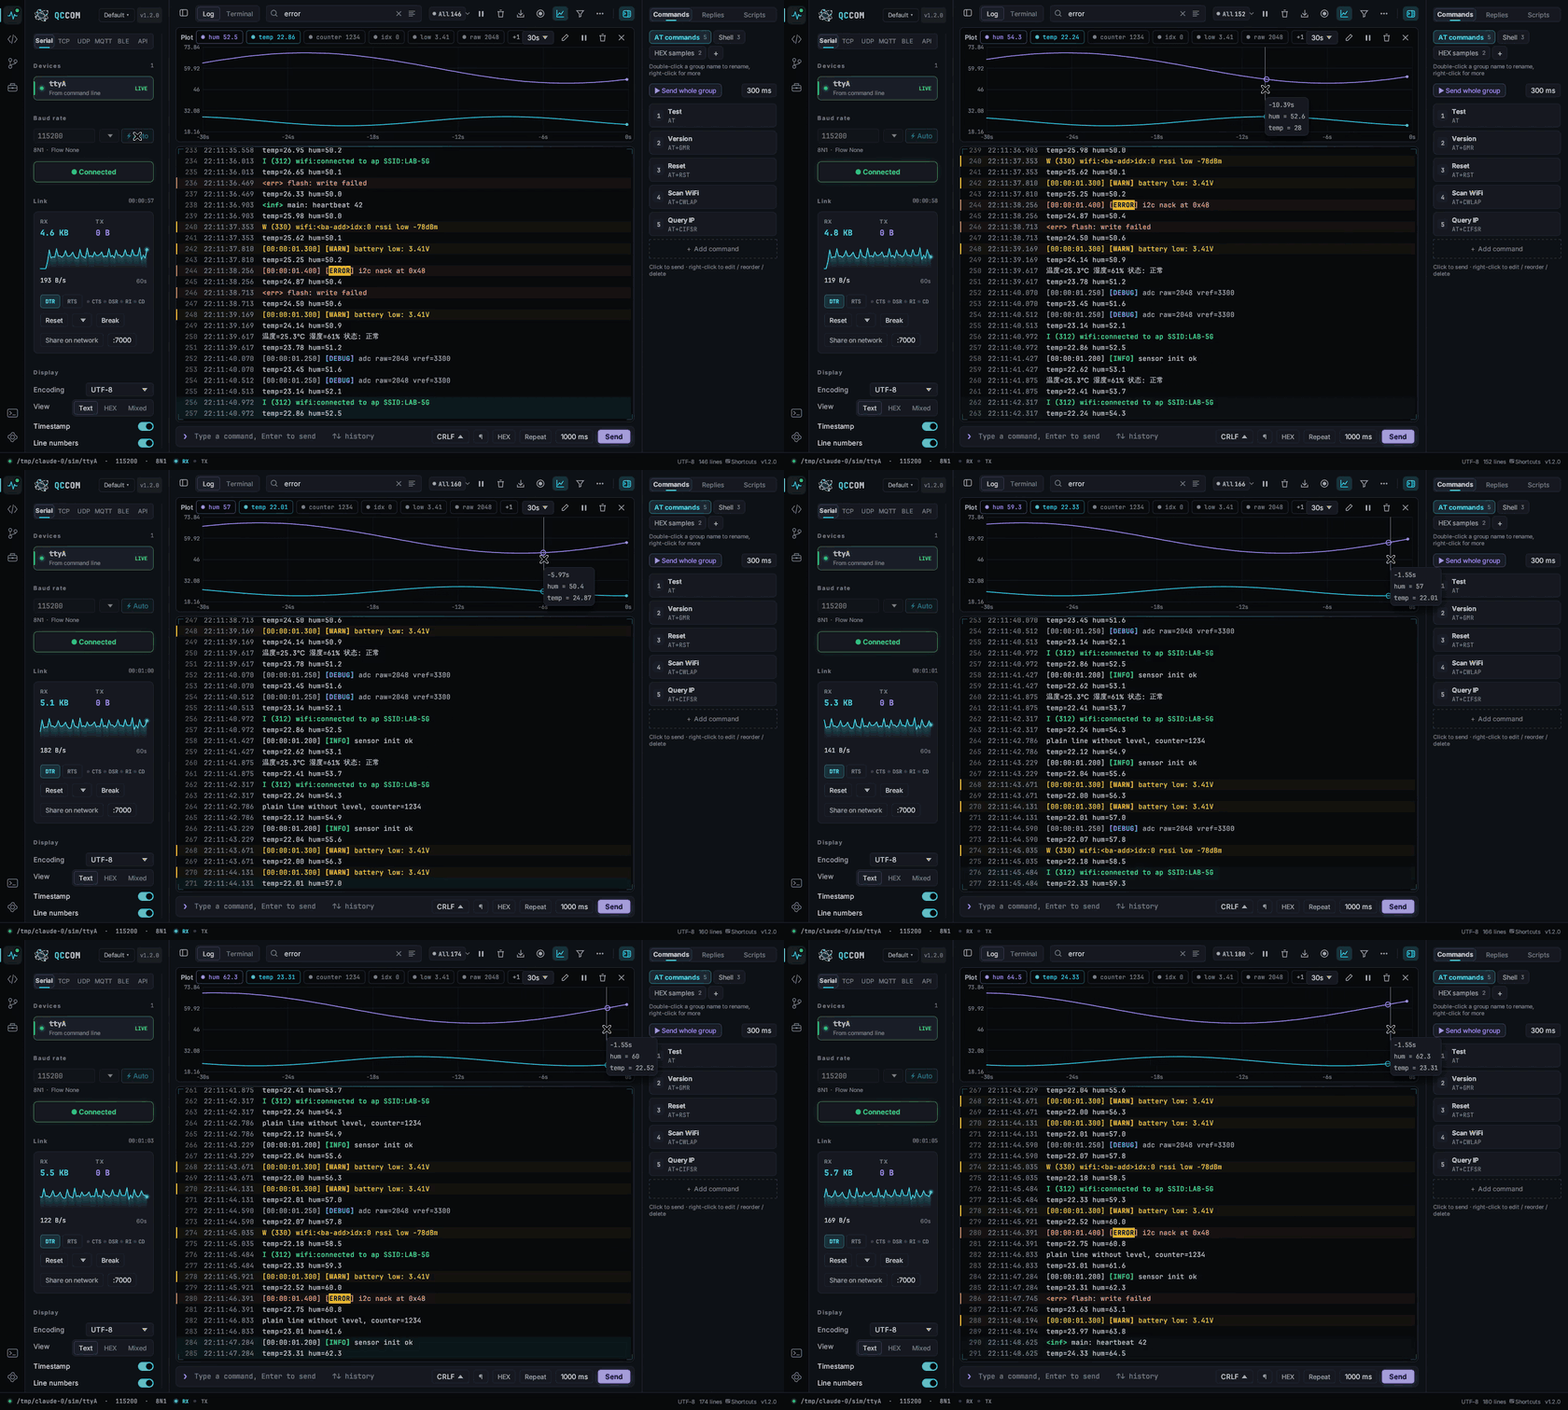
Numbers in the log become live plots.

Values are pulled out of the log and plotted as they arrive, together with filters, highlight rules, auto-replies and scripts for tuning sensors and control loops.

Numbers in the log become live plots.
06 — Toolbox

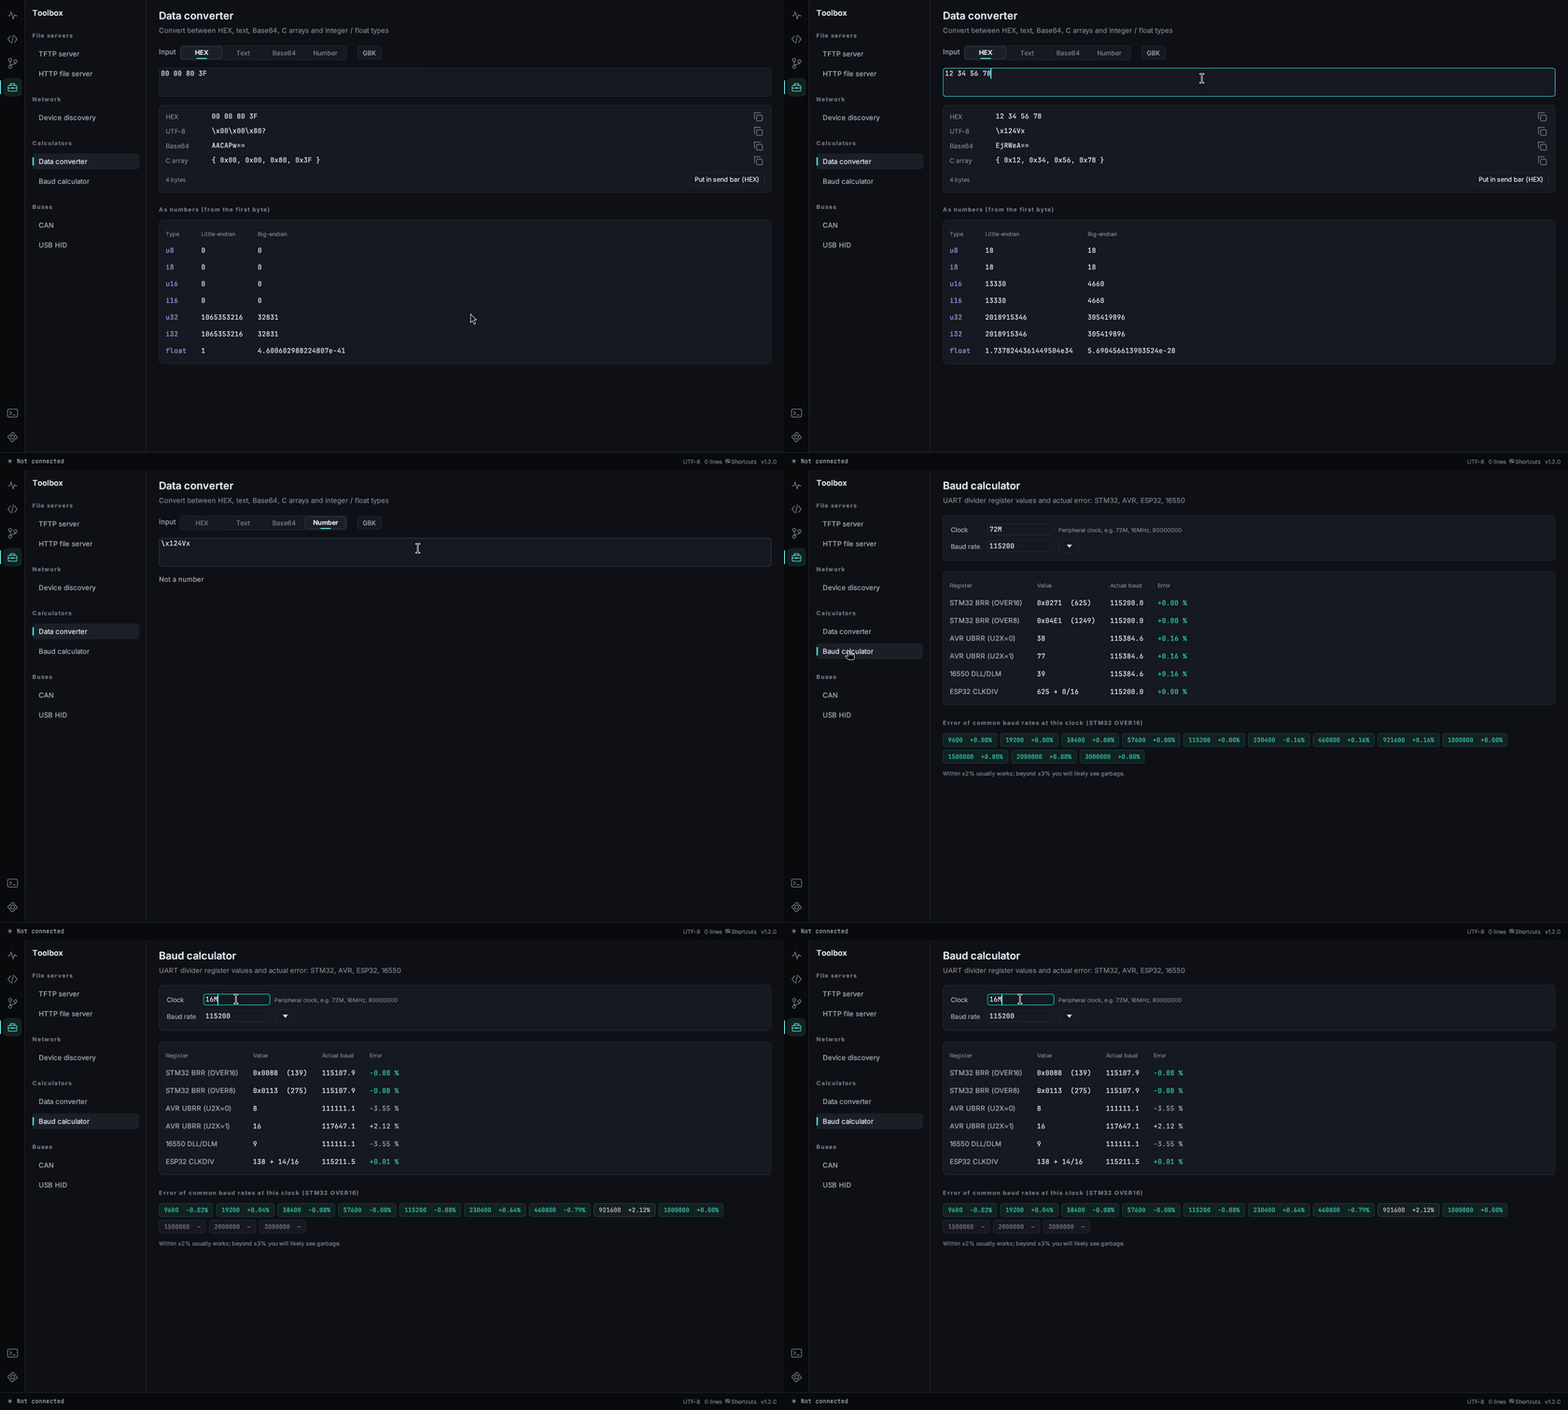
Dozens of embedded tools in one window.

TCP / UDP / MQTT / BLE / SSH, Modbus, CRC, number conversion, HEX / ELF / map viewers, firmware size diff, SVD registers, TFTP / HTTP file servers and more. Ctrl+Shift+B opens the searchable toolbox.

Dozens of embedded tools in one window.
Features

What you reach for while debugging, in one place.

Serial

  • Automatic port scan with chip name and VID:PID
  • Automatic baud-rate detection (18 common rates)
  • UTF-8 / GBK / ASCII / HEX views
  • DTR / RTS / Break, one-click reset (incl. ESP32)
  • Several ports at once, virtual port sharing

Logs

  • Linux-terminal style colors, millisecond timestamps
  • Level colors, keyword highlights, filter, search
  • Record to file (split by size or time), replay
  • Grouped quick commands, Alt+1…9 hotkeys
  • Live plots, auto-replies, Rhai scripts

Terminal

  • Full VT100 serial terminal
  • Built-in shell panel (PowerShell / cmd / bash)
  • Releases the port for flash commands and reopens it
  • SSH / Telnet sessions

Network

  • TCP client / server, UDP
  • MQTT (TLS, QoS 0–2), WebSocket
  • Bluetooth LE scan, read / write, notify
  • Modbus RTU / TCP master and slave
  • HTTP API testing

Code & Git

  • Code browser, go to definition, macro expansion
  • Project-wide search and replace
  • Git graph, stage by hunk, commit and push
  • File / folder / hex compare, three-way merge
  • Review AI and other external edits block by block

Embedded tools

  • HEX / BIN / ELF / map viewers, firmware size diff
  • SVD registers, decoded on hover
  • Stack analysis, vector table, struct parser
  • CRC, number conversion, font / image to C arrays
  • Beginner-friendly circuit simulator

Coming from SSCOM or another serial terminal? See where common tasks are in QCCOM.

Download

Download QCCOM

Windows 10 / 11 x64

qccom-windows-x64.exe · 11.5 MB · v1.9.6 · 2026-11-03

Download for Windows

SHA-256 235f42427ea1ffde8c87bc0554642d487093d8925ba5645bf02f896e8c4a8cf8

Linux x64

qccom-linux-x64 · v1.9.6

Download for Linux

SHA-256 05108925d8e20237737b3f0745658806141241e8095e33db3751a36dc8ac0f76

  1. Put the file in any folder and double-click it. Nothing to install.
  2. Plug in your board or USB-to-TTL adapter. The port appears and is selected; press F5 to connect.
  3. Unknown baud rate? Click “⚡ Auto”. Garbled characters? Switch the encoding between UTF-8 and GBK.
  4. Create a qccom-data folder next to the exe for portable mode.

The exe is not code-signed yet, so Windows may show “Windows protected your PC” on first run. Click “More info” → “Run anyway”. Use the SHA-256 above to check the file. Code signing policy

Release notes v1.9.6
1. Windows IME: Enter commits the typed letters instead of starting a new line
2. Terminal commands that use the open serial port (e.g. esptool.py -p COM3) release it first and reopen it afterwards
3. Open / Close button for the serial port on the side page
4. “Open with QCCOM” from Explorer brings the window to the front
5. Community posts and replies can be selected and copied
Contact

zenghi

Questions and feedback: 309966755@qq.com · GitHub Issues